As a digital marketer with more than seven years of experience, I’ve seen Google Analytics grow into a very useful tool for studying how people visit websites and interact with them. Google Analytics is still one of the best free tools for getting useful information about your website and marketing efforts in 2024.
This post will show you how to get the most out of Google Analytics this year to look at your website’s traffic, find groups of high-value visitors, and find ways to make it better.
Table of Contents
The Importance of Understanding Your Website Traffic
First, it’s important to know why website traffic analytics are so important before you learn how to use Google Analytics. In a broad sense, knowing how many people visit your website lets you:
- Find the channels for getting visitors that are working well. You can increase the number of marketing channels, campaigns, and pieces of content that bring in good users.
- Find the channels that aren’t working. You can either improve or stop projects that aren’t helping you reach your goals.
- Give different campaigns and channels credit for conversions. You can put your budgets on the projects that bring in the most money.
- Look for ways to improve things. Analytics show you weak spots in the customer journey that you can fix by making changes to the design, copy, content, etc. of your website.
- Make visitors’ experiences unique. By dividing users into groups based on their traits and actions, you can send them more relevant content and deals.
You can see that using Google Analytics gives you a lot of information about how well your digital marketing is working. It’s one of the best ways to get the most out of your marketing.
Key Google Analytics Reports and Tools to Leverage
Now, let’s look at some of the best reports and tools that Google Analytics has to offer for learning about the people who visit your website:
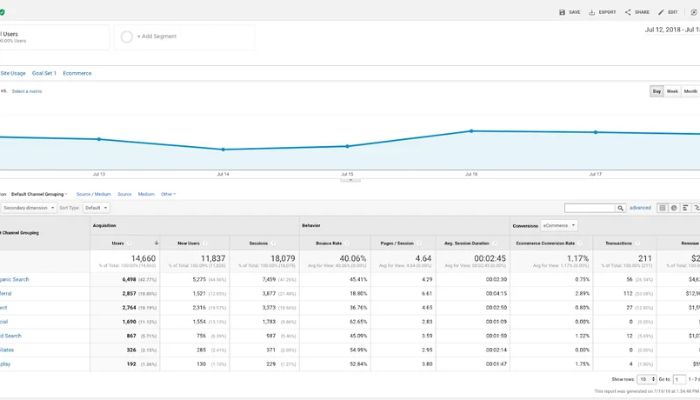
- Reports on Acquisition: These reports show you how people find your website in the first place. The “All Traffic” report shows where your visitors are coming from, and the “Channels” report breaks it down by channel type, such as organic search, social media, referrals, and more. Look at long-term trends and get specific about the channels and sources that are bringing in the most sessions and sales.
- Audience Reports: These reports collect useful information about the types of people who visit your website and how they behave. The “Geo” report shows where visitors have been. “Technology” shows off browsers, operating systems, and other gadgets that are used. “User flow” shows you the click paths people take as they browse your site. Use these insights to make the site experience more personal.
- Behavior Reports: Behavior reports show you how people use your site. “Site content” shows you the pages that people visit the most. “Events” keep track of how people interact with site elements. “Funnels” shows the points where a conversion journey stops. Use these reports to find problems with usability and chances to make things better.
- Cohort Analysis: Cohort reports show how groups of users (cohorts) use your site over time. You can see trends like the number of repeat visits, conversions, and people who stay with the site by cohort. To find high-value visitors that you should target, use cohorts.
- Custom Dashboards: Thanks to dashboards, you can put together reports that show the most important business metrics. Watch live data on things like traffic, engagement, conversions, and more. Dashboards that are made just for you keep you in the loop.
- Custom Segments: Segments let you separate your data into groups of users that you want to study. For instance, you can make segments to see traffic from social campaigns, visitors from certain areas, email list subscribers, and other groups. Find your best customer groups.
- Attribution Modeling: Attribution tells you how much credit to give previous interactions for conversion events. Figure out which marketing channels and campaigns add the most value to the customer journey by using attribution.
You can look at your data in a lot more reports on Google Analytics. These are some of the best tools for getting useful information about website traffic.
Analyzing Your Website Traffic Data
Google Analytics gives you the reports, but you need to be very good at analyzing data to figure out what they mean. Here are my top tips for how to look at your website’s traffic reports to help it grow:
- Find trends and outliers: Look at changes in traffic metrics from week to week and month to month to find patterns and strange events. Is there a channel that brings in more sessions? Did a new campaign make a lot of people buy something? Did something technical cause a drop in visitors? Trend analysis helps us understand things better.
- Talk to the right people – When you read reports, you should have certain questions ready. For example, which landing pages have the most people leaving? Which email campaigns lead to the most sales? Which blog posts get the most traffic from search engines? As you look at things, keep your business goals in mind.
- Make use of segmentation – To get more useful information, separate important user groups in your data. Check out the reports for visitors from high-value areas, users brought in by social campaigns, email subscribers, and other significant groups.
- Link insights to actions—Chose which insights should guide your actions. This is the most important part of analyzing your data. Since Facebook ads have led to sales, you might spend more on them. Or you’ll improve landing pages that don’t work very well. Use your insights to make things better.
- Pay attention to important metrics—There is a lot of data, and it’s easy to get sidetracked by metrics that aren’t important. Pay attention to the few most important KPIs that will help you reach your goals. Sales, conversions, cost per acquisition, and customer lifetime value are all common examples.
- Check your analytics often—don’t just glance at them once in a while. Check back often to see what’s new and see how the changes you make are affecting things. Try to check in every week.
It’s important to use Google Analytics to keep an eye on how well your digital marketing is working. If you want to get useful information from your website traffic data, make sure you follow these tips.
Optimizing Your Website Traffic
After looking at your Google Analytics reports, the last thing you need to do is find ways to improve your website’s traffic. Here are some common ways to improve your SEO:
- Making website copy better: Change headlines, body copy, and calls to action based on how well key landing pages are doing.
- Increasing page speed—Loading pages faster is better for both users and SEO. Reduce the size of images and code, and make servers run faster.
- Making content that is more targeted: Focus your content on the topics that bring in the most organic search traffic.
- Fixing technical problems—Fix site problems found in Analytics that are causing a lot of people to leave quickly.
- Changing how much you spend on marketing—Raise or lower budgets for channels and campaigns based on how well they do.
- Getting better at email campaigns: Change the content, segmentation, and automations of your emails to get more people to open and click on them.
- Making CTAs work better: Use visitor behavior data to make CTAs that get people to do what you want them to do.
- Personalizing experiences means giving visitors content and deals that are more relevant to them based on their behavior and interests.
- Retargeting visitors: To get people who left without buying back, you should market to them again.
Google Analytics is great because it lets you test changes over time and see what happens by looking at your website traffic.
Conclusion
Google Analytics is still one of the best free ways to learn more about the people who visit your website. Use its many reports and features to look at how visitors find your site, how they behave, how many of them become customers, and more. When you do your analysis, you should focus on finding ways to improve performance and optimization opportunities.
You can get the most out of your website traffic and keep getting better results if you use the right analytical approach. Google Analytics gives you the information you need to make smart decisions about how to improve your website and digital marketing.

Shivam Mishra is the lead writer at webcourses.in, where he shares his expertise in web development, particularly in the MERN stack (MongoDB, Express.js, React, Node.js). With a solid foundation in Java and Data Structures & Algorithms (DSA), Shivam creates content that resonates with developers and tech enthusiasts alike. As a former Web Development Club Captain, he has led projects like an Air-BNB replica and a YouTube clone. Recognized as a two-time CODE-Hunt winner and LinkedIn Top Voice in Web Development, Shivam brings a wealth of knowledge to every article.
Connect with Shivam on LinkedIn.